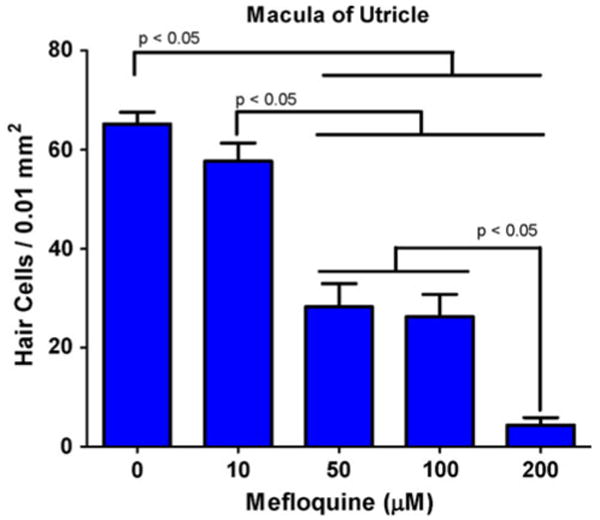
Fig. 2.

Mean (+1 SD) number of hair cells per 0.01 mm2 in the maculae of the utricle as a function of mefloquine dose. A one-way analysis of variance showed a significant effect of treatment (P < 0.001). Tukey's post hoc analysis indicated that 50, 100, and 200 μM were significantly different (P < 0.05) from control (0 mM); 10 mM was significantly different (P < 0.05) from 50, 100, and 200 mM, and 200 μM was significantly different (P < 0.05) from 50 to 100 μM
