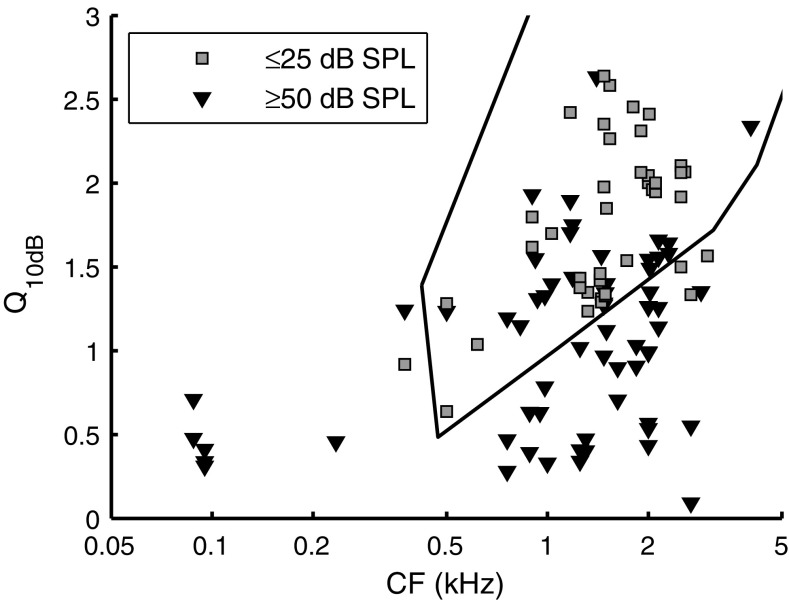
FIG. 5.
Tuning sharpness distribution. Q 10dB is plotted as a function of CF for two ranges of SPLs, as indicated in the legend: ≤25 dB SPL (N = 66; 27 ANFs) and ≥50 dB SPL (N = 43; 18 ANFs). Q 10dB values for intermediate SPLs were left out to reduce cluttering of symbols. The solid black line indicates a contour around Q 10dB values obtained from FTCs by Ohlemiller and Echteler (1990).

