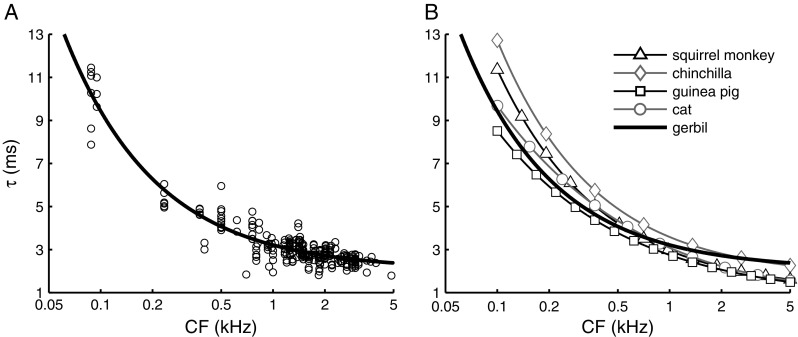
FIG. 6.

Near-CF group delay τ as function of CF. A Group delay estimated from a 0.4-octave band around CF (N = 257; 88 ANFs). Multiple group delay estimates are often extracted from a single ANF stimulated at multiple sound intensities. The solid line is a power function fitted to the data (τ = a + b∙CFc with a = 2.07±0.11, b = 1.15±0.13, and c = −0.808±0.04). B Comparison of near-CF group delay for different mammalian species. Squirrel monkey (τ = 1 + 1.95∙CF−0.725) is from Anderson et al. (1971), chinchilla (τ = 1.721 + 1.863∙CF−0.771) from Recio-Spinoso et al. (2005), guinea pig (τ = 0.661 + 2.088∙CF−0.575) is adapted from Palmer and Russell (1986, Fig. 8), and cat (τ = 1.25 (1 + (6/CF)2)0.25) from Goldstein et al. (1971). Symbols shown in this panel are not data points but are added to distinguish the curves.
