
FIG. 7.
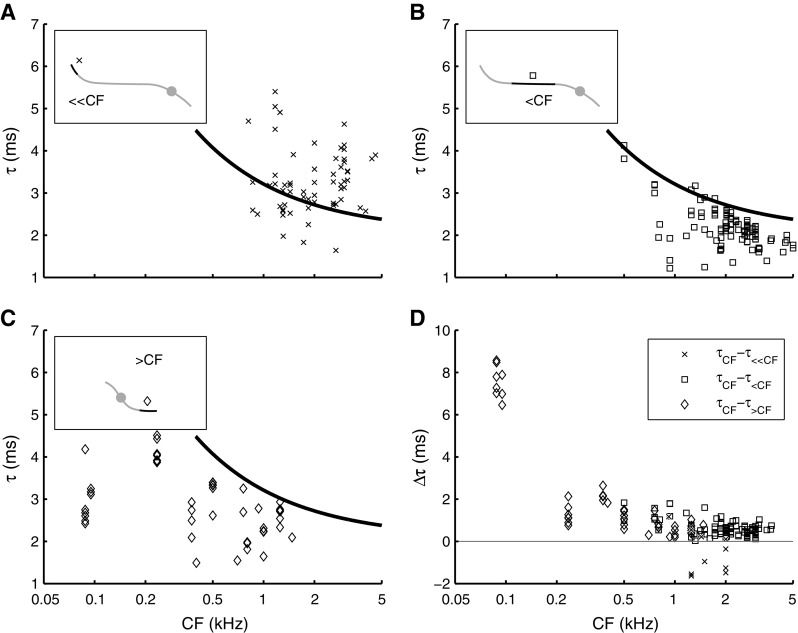
Off-CF group delay τ as function of CF. Insets show schematic phase curves, highlighting the frequency region over which group delays were estimated (see also Fig. 4b). Group delay estimated A in the 100–400-Hz region (≪CF; N = 67; 34 ANFs); B 1.5–0.6 octaves below CF (<CF; N = 132; 54 ANFs); C >0.6 octaves above CF (>CF; N = 46; 16 ANFs). The solid line in A–C is the same power function as described in Figure 6a. D Direct comparison between off-CF group delays (τ ≪CF, τ <CF, and τ >CF) and near-CF group delay (τ CF) evaluated from single phase curves by comparing slope values across frequency. The difference between near-CF group delay and each of the three off-CF group delays, Δτ, is plotted as function of CF. The same symbols as in A–C are used. Associated to A is τ CF − τ ≪CF (N = 10; six ANFs), to B is τ CF − τ <CF (N = 107; 41 ANFs), and to C is τ CF − τ>CF (N = 44; 16 ANFs).