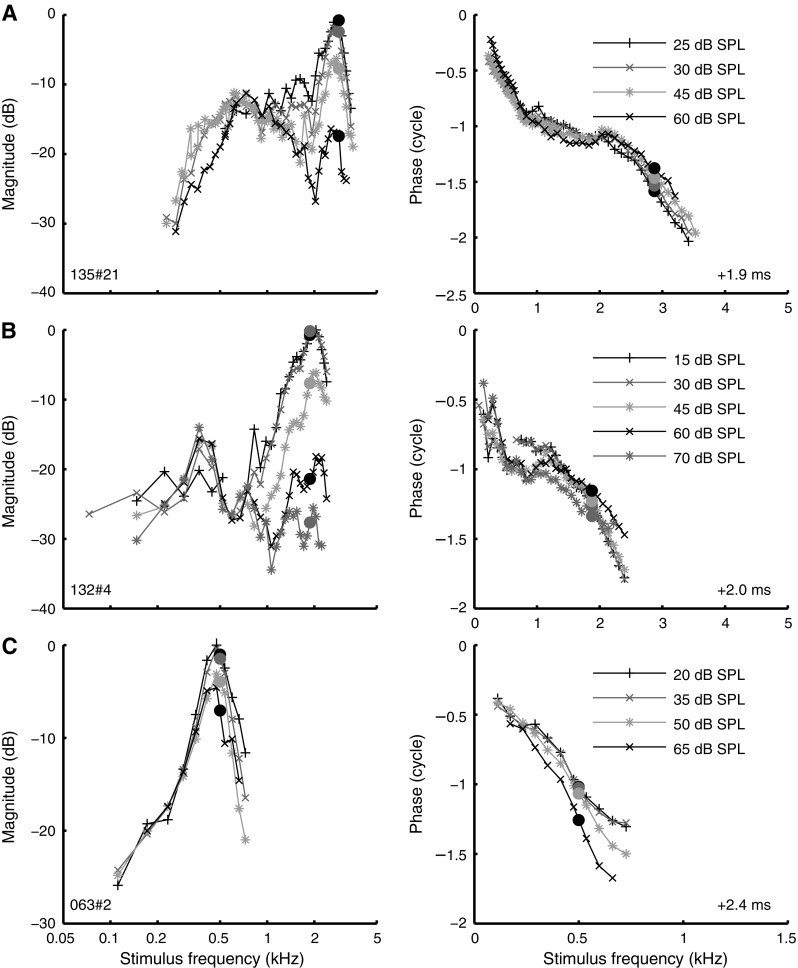
FIG. 8.

Estimating cochlear mechanical compression from ANF data. Amplitude curves (left column) and phase curves (right column) obtained at different SPLs as indicated in the graph. Amplitude curves were aligned at their low-frequency tail, allowing the assessment of nonlinear growth at CF (see text). Layout of phase data as in Figure 2, right panel. Data of 3 ANFs are shown: A CF 2.87 kHz; B CF 1.88 kHz; C CF 500 Hz.
