FIG. 9.


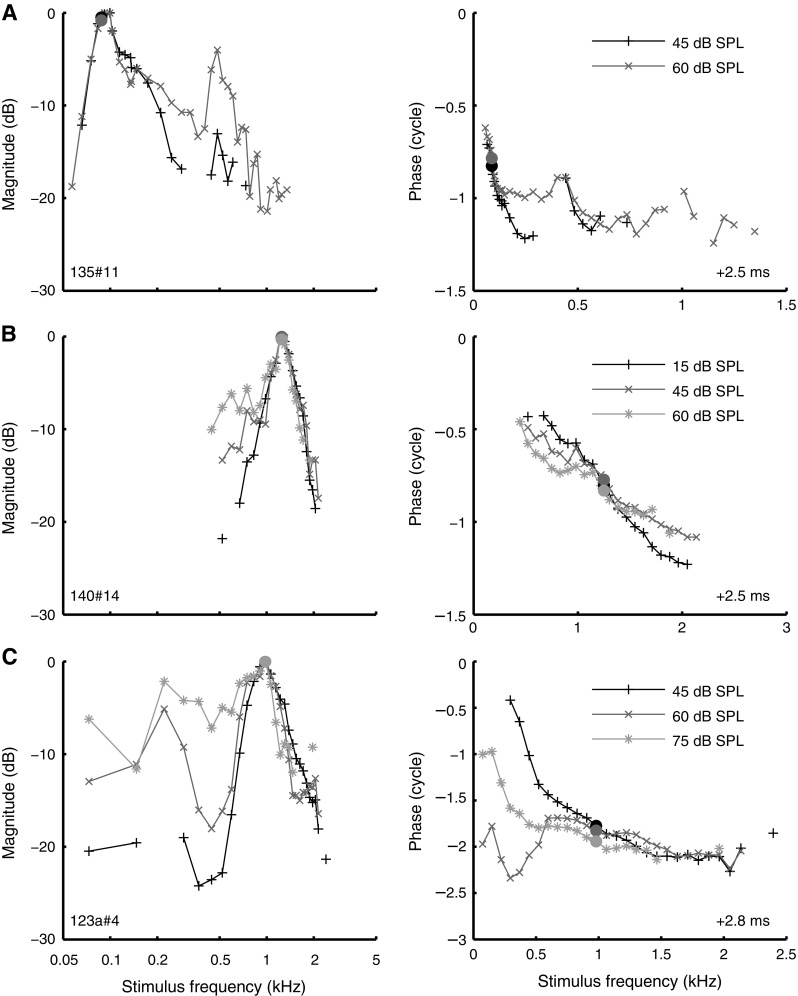
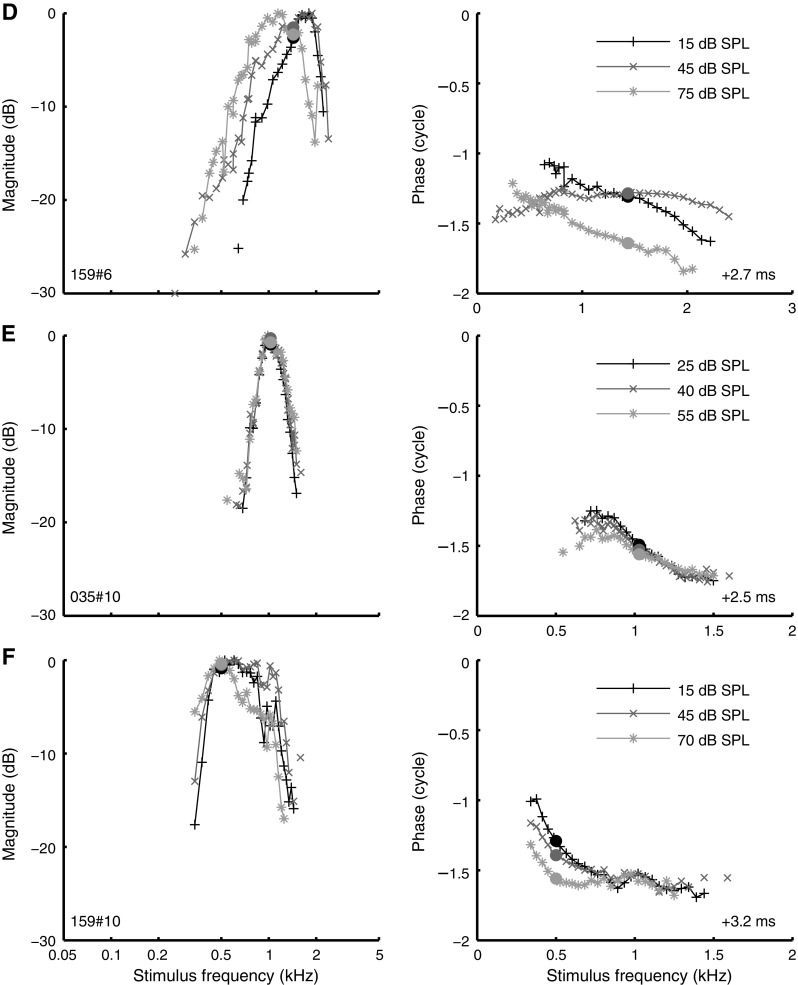
Effect of SPL on the shape of amplitude curves and phase curves. Layout as in Figure 8, but the peak of each amplitude curve was arbitrarily set to zero. A CF 88 Hz; B CF 1.25 kHz; C CF 0.98 kHz; D CF 1.44 kHz; E CF 1.03 kHz; F CF 500 Hz.


Effect of SPL on the shape of amplitude curves and phase curves. Layout as in Figure 8, but the peak of each amplitude curve was arbitrarily set to zero. A CF 88 Hz; B CF 1.25 kHz; C CF 0.98 kHz; D CF 1.44 kHz; E CF 1.03 kHz; F CF 500 Hz.