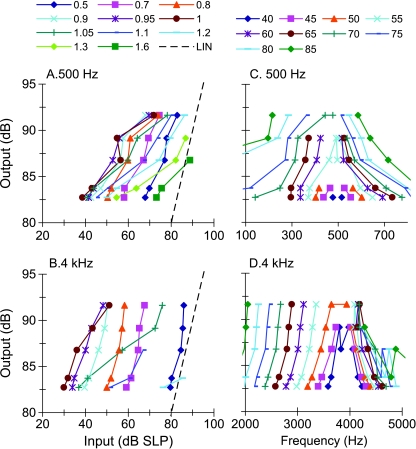
FIG. 4.
A, B Inferred I/O curves for sinusoidal stimuli at 500 Hz and 4 kHz. Each line is for a different stimulus frequency, as indicated by the inset in units relative to the probe frequency. Dashed lines illustrate linear responses with zero gain. C, D Corresponding isolevel curves. Each line is for a different input level from 40 to 85 dB SPL in 5-dB steps, as indicated by the inset.

