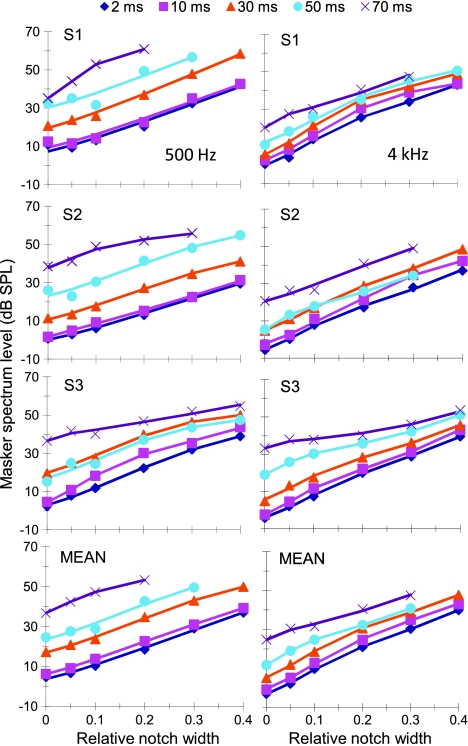
FIG. 6.
Isogap NN functions for probe frequencies of 500 Hz (left) and 4 kHz (right). Each panel illustrates results for individual subjects or the mean, as indicated in the top-left corner of each panel. Different symbols illustrate results for different masker–probe gaps, as indicated by the inset at the top (in ms). Lines illustrate corresponding fits to the experimental data using the power spectrum model assuming symmetrical roex filter shapes.

