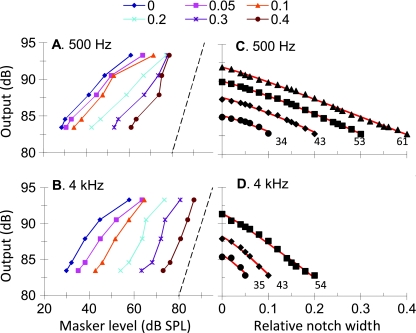
FIG. 7.
A, B Inferred peripheral I/O curves for notched-noise stimuli with various relative notch widths, as indicated by the inset at the top. Dashed lines illustrate linear responses (slope = 1 dB/dB). C, D Inferred isolevel curves as a function of relative notch width. Each curve is for a different masker overall level as indicated by the numbers next to each curve (in dB SPL). Lines illustrate model fits assuming symmetrical roex filter shapes.

