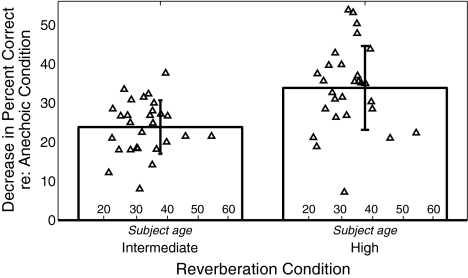
FIG. 4.
Each Individual listener performed best in the anechoic condition, an effect that is unrelated to age or other factors. Symbols show the differences between each individual subject’s percent correct performance in anechoic and intermediate reverberation conditions (left) and in anechoic and high reverberation conditions (right), plotted against subject age. Bars show the across-subject means in the difference (error bars show the across-subject standard deviation).

