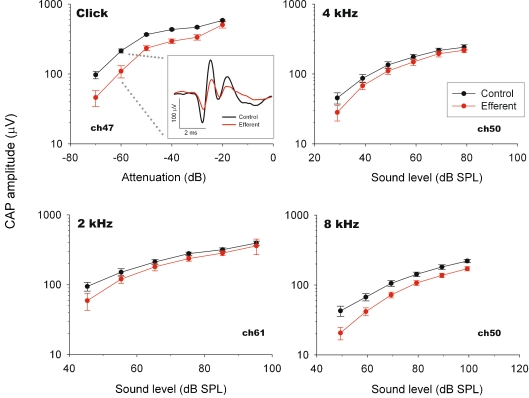
FIG. 3.
CAP input–output curves. CAP amplitudes with (red) and without (black) efferent electrical stimulation as a function of acoustic stimulus intensity recorded in three chinchillas. Efferent-produced CAP reductions are greater at lower acoustic stimulus intensities. CAP traces with and without efferent activation are shown in inset box.

