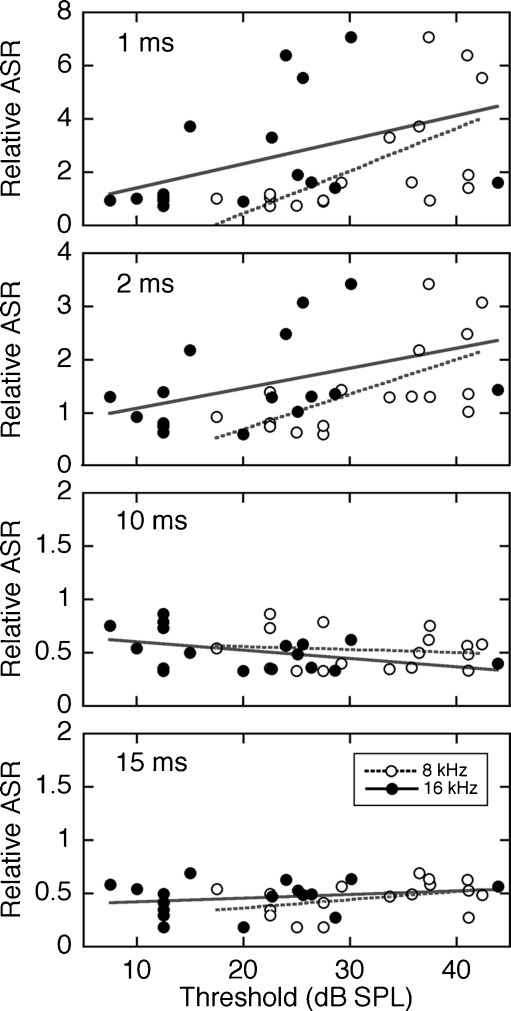
FIG. 6.
Correlations between ABR thresholds and relative ASR measures. Results are shown for noise-reared α9KO mice at the four lead times that produced statistically significant decreases in GIASR (Fig. 4B). At each lead time, the ASR is plotted twice in relation to the 8- and 16-kHz thresholds of the same subject. The same thresholds are repeated at all four lead times. Linear fits (dashed and solid lines) revealed statistically significant correlations (P < 0.05) between ASR and 8-kHz thresholds at lead times of 1 and 2 ms.

