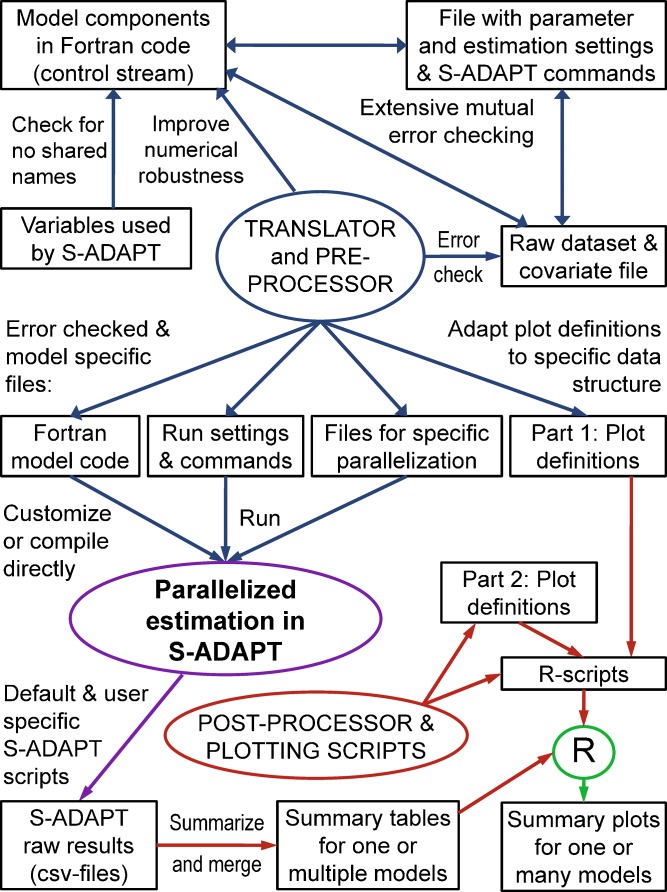
Fig. 1.
Flowchart for model code, raw data, results, and plots as implemented in the translator, pre-processor, and post-processor scripts of SADAPT-TRAN that interact with S-ADAPT for nonlinear mixed-effects modeling and R for plotting. Programs and scripts are shown in circles, data files as boxes, and error checks or operations as arrows. Blue arrows denote operations by the SADAPT-TRAN translator and pre-processor, purple arrow denotes operations by S-ADAPT, dark red arrows denote operations by the post-processor and plotting scripts, and the green arrow refers to R

