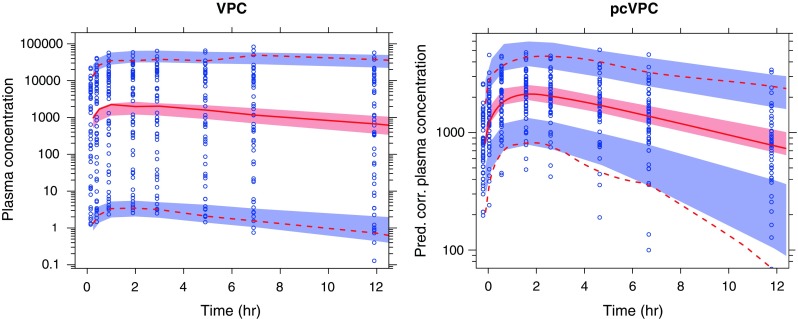
Fig. 1.

A simulated example of a SAD study with a 10,000-fold dose range and nonlinear pharmacokinetics. The diagnosed model lacked any form of estimated correlation between Vmax and volume of distribution (neither a common covariate nor estimated BSV correlation). The solid red line represents the median observed plasma concentration (nanogram per liter; prediction-corrected plasma concentration in the pcVPC to the right), and the semitransparent red field represents a simulation-based 95% confidence interval for the median. The observed 5% and 95% percentiles are presented with dashed red lines, and the 95% confidence intervals for the corresponding model predicted percentiles are shown as semitransparent blue fields. The observed plasma concentrations (prediction corrected in the pcVPC) are represented by blue circles
