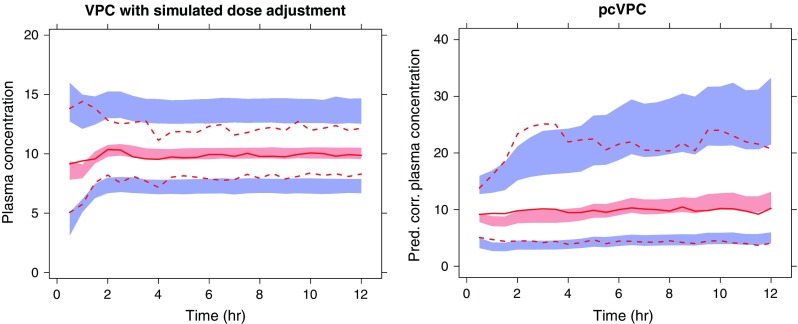
Fig. 5.

A simulated example where a loading dose was given followed by a constant infusion. The infusion rate was altered to achieve the target concentration of 10 units. The true underlying model is a one-compartment model with autoinduction of CL. A simple one-compartment model without autoinduction has been fitted to the data. The left hand VPC has been simulated using the same dose alteration algorithm as in the original study. The pcVPC (right) have been simulated using only the realized design. Outer percentiles (dashed red lines) are 2.5% and 97.5% (95% interpercentile range), the semitransparent blue fields are the corresponding model-based confidence intervals, the solid red line represents the observed median, and the semitransparent red field represents the corresponding model-based confidence interval. The actual observations are not plotted in this picture
