
Figure 3.
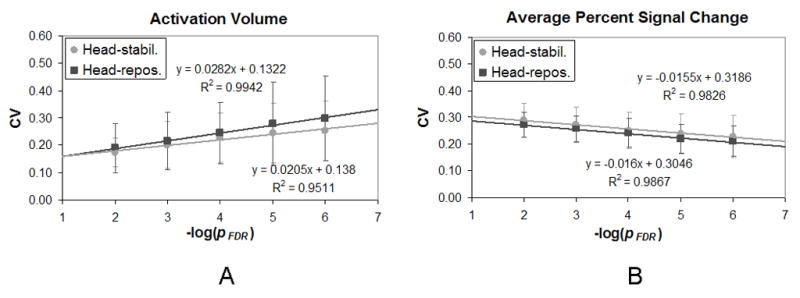
The coefficient of variation (CV) is plotted against the −log of the pFDR threshold in the right hemisphere for (A) activation volume, and (B) percent signal change. Circles represent the head-stabilization runs while squares represent the head-repositioning runs. (Error bars represent standard deviation.)