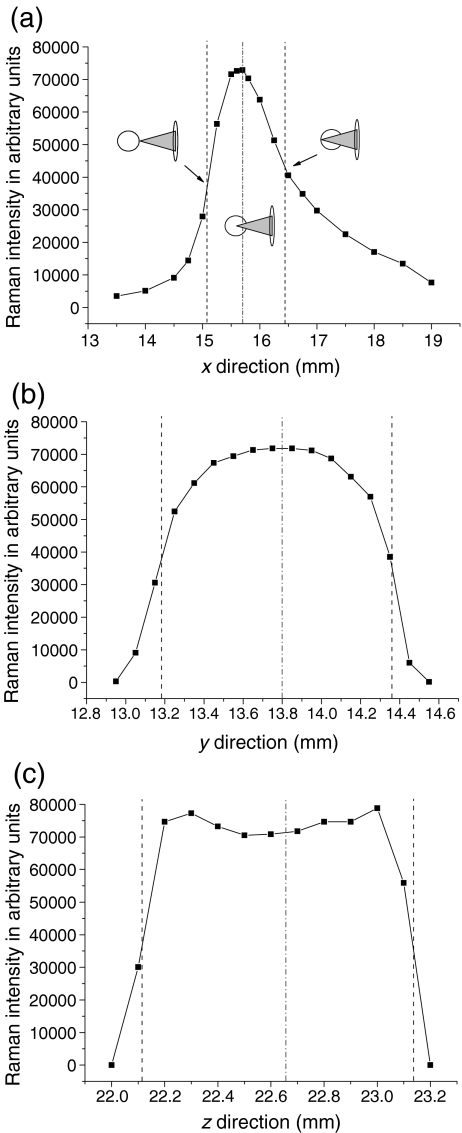
Fig. 2.
Intensity profiles of an acoustically levitated DMSO drop of approximately 1 µL measured for the very strong Raman band at 669 cm−1 by changing the xyz position of the drop with respect to the focal point. The outer dashed lines in each graph determine the border of the drop, while the inner dashed line indicates the xyz position which was normally used. In a, the focal point of the incoming laser beam was in front of the levitated drop on the left side of the graph while it was behind the drop on the right side of the graph. For all plots, the laser was positioned at the central position of the other two axes

