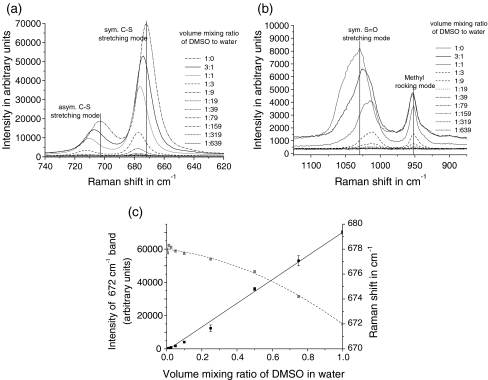
Fig. 4.
Raman spectra (sampling time 30 s) of acoustically levitated drops (approximately 5 µL) containing DMSO and water. a Shows the spectral region of the symmetric and antisymmetric C–S stretching modes; b the symmetric S=O stretching mode and the methyl rocking mode; c highlights the evolution of band intensity and band position of the very strong symmetric C–S stretching mode at 672 cm−1. (Note: in contrast to reference data of Schrader [29], the band positions of the symmetric and antisymmetric C–S vibration modes of pure DMSO are slightly blue-shifted while the band position of the symmetric S=O stretching mode is slightly red-shifted. Both are probably caused by a small amount of water in the DMSO samples)

