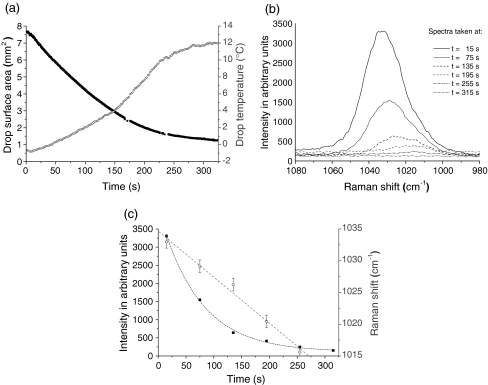
Fig. 7.
Evaporation of an acoustically levitated methanol drop in ambient air. a Drop surface and drop temperature were measured nearly each second using a CCD camera and an IR thermography system, respectively [24]. b Raman spectra were recorded nearly every minute with a sampling time of 5 s. c While intensity of the Raman band (black) is decreasing exponentially, its position (gray) is (red-)shifted linearly with time during drop evaporation

