Fig. 6.
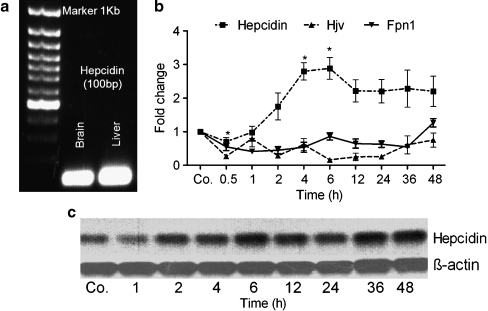
Changes in the amount of hepcidin, hemojuvelin (Hjv), and ferroportin 1 (Fpn1) transcripts in brain tissue during APR. a Ultraviolet image of agarose gel (1%) demonstrating the expression of the hepcidin gene (amplicon size 100 bp) in the brain and liver. b mRNA expression of hepcidin, Hjv, and Fpn1 analyzed by real-time PCR and normalized by using β-actin and ubiquitin C as housekeeping genes in the brain at various time points after intramuscular injection of TO. c Change in gene expression of hepcidin at the transcriptional level as shown by Southern blot analysis with β-actin as the loading control (Co. saline-treated control). Results represent mean values±SEM (*P<0.05, analyzed by one-way ANOVA; n=3)

