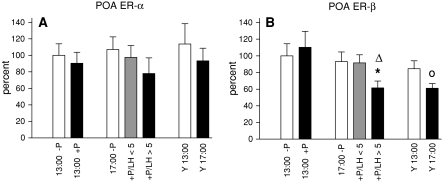
Fig. 3.
ER mRNA expression in the POA. a shows the expression profile of ER-α, b depicts mRNA levels for ER-β. In this and the following figures mRNA expression of middle-aged rats analyzed at 13:00 without progesterone treatment was set as 100% and the mean values of the other treatment groups were expressed in relation to this group. Data are shown as mean ± SEM. * = P < 0.05 versus –P, ∆ = P < 0.05 vs. 13:00 +P, o = P < 0.05 versus Y13:00

