Fig. 11.

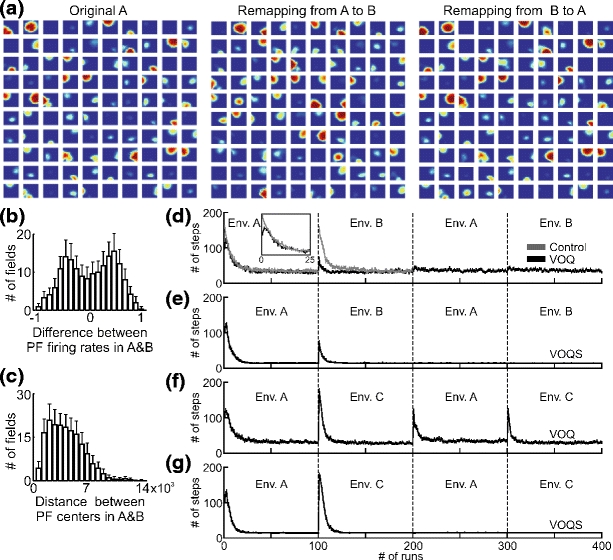
(a) Remapping of PFs from environment “A” to “B” and from the environment “B” back to “A”. The same selected cells (100 of total 500) are presented in all three cases. (b) Average difference between maximum firing rate of PFs in environment “A” and “B” together with standard deviation (SD) are plotted for 100 experiments. -1 means that the cell stopped firing when switched to the other environment and +1 means that the cell was off in environment “A” but turned on when moved to environment “B”. (c) Average distance between centers of PFs in environment “A” and “B” together with SD are plotted for 100 experiments. (d-g) Comparison of goal navigation strategies with respect to different environmental setups: (d), (e) - only environmental change, (f ), (g) - the environment an the location of the goal changed (see Fig. 3(a, b)). The average number of steps needed to find the goal are plotted versus the number of runs in 200 experiments. The vertical bars show the standard error mean (SEM). Cases VOQ and VOQS are as explained in Fig. 9(a). Control: the same as in case VOQ, but we start learning with random Q-values at the beginning in the environment “A” and “B” whereas in case VOQ we initialize weights with zero Q-values only at the very beginning and do not reset values while switching between the environments
