Fig. 5.

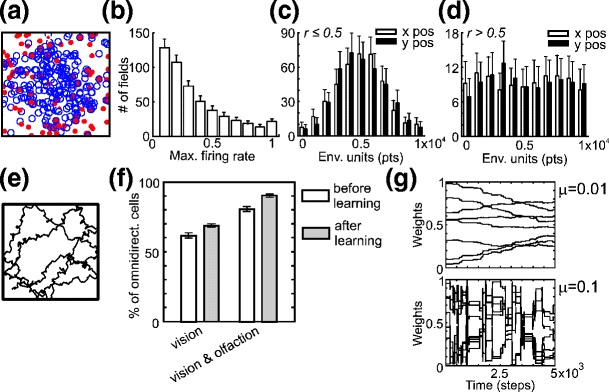
(a) Distribution of PF centers within the environment from single experiment. Dots denote centers of PFs with maximum firing rate r > 0.5 whereas circles denote centers of fields with maximum firing rate r ≤ 0.5. (b) Distribution of maximum firing rates r of 500 cells; average and standard deviation (SD) for 100 experiments. (c, d) Distribution of x and y position of place cell centers with maximum firing rate r ≤ 0.5 (c) and r > 0.5 (d); average and standard deviation (SD) for 100 experiments. (e) Example of the rat’s trajectory when the rat explores the environment randomly. (f) Percentage of omnidirectional cells before and after learning (rate factor μ = 0.01). The average together with confidence intervals (95%) is shown in 20 experiments. (g) Connection weights between input neurons and place cells (see Fig. 1(c)) depending on the rate factor μ
