
Fig. 5.
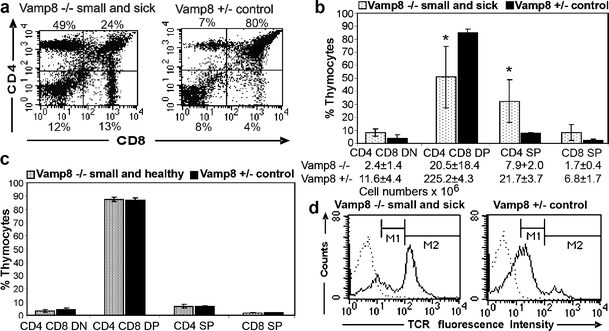
Proportion of CD4+CD8+ DP thymocytes was decreased in small and sick Vamp8−/− mice. a Representative flow cytometric analysis of thymocytes from a 10-day-old small and sick Vamp8−/− mouse showing the presence of the four major subpopulations defined by CD4 and CD8 markers. The proportion of DP cells was drastically reduced compared with that of a heterozygous littermate. b Summary of the proportion of CD4/CD8 subsets obtained from small and sick Vamp8−/− mice and heterozygous littermates (bars percentage of thymocytes subpopulations ±SD; n = 5, age: 9–12 days, *P < 0.05, U test, corrected for multiple testing). The absolute cell number of CD4/CD8 subsets in 9- to 13-day-old small and sick Vamp8−/− mice and heterozygous littermates is given below (P = 0.0039, U test, for the comparisons of Vamp8–/– and Vamp8+/– mice). c Small and healthy Vamp8–/– mice did not show alterations of thymocytes subsets compared with heterozygous littermates (n = 3, age: 9–12 days). d Representative histogram of T cell receptor-αβ (TCRαβ) staining of thymocytes from a small and sick Vamp8−/− mouse and a heterozygous littermate (dotted line cells stained with the isotype control, solid line staining with an anti-TCR antibody). As seen left, the percentage of cells expressing the TCR at high intensity was increased in the small and sick Vamp8–/– mice compared with the heterozygous littermate (right). However, the intensity of fluorescence was in the same range for the TCRhigh (marker M2: mean fluorescence intensity 232 for Vamp8−/− and 258 for Vamp8+/−) and the TCR low (marker M1: mean fluorescence intensity 45 for Vamp8−/− and 39 for Vamp8+/−) cells in the small and sick Vamp8−/− mice and in the control mice