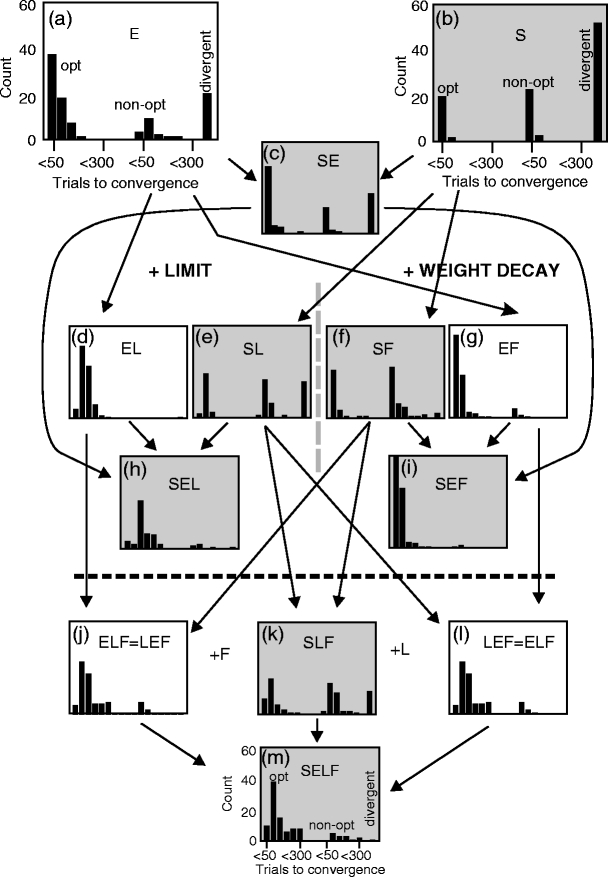
Fig. 5.

Statistical analysis of mixed strategies for path generation and learning as given inside each panel for 100 experiments each. Arrows indicate how properties get inherited from each other. Gray panels are the ones containing an S component. Three histograms are shown in each panel: convergence to an optimal path (left histogram), to a non-optimal path (middle histogram) and divergence cases (right single-bin). For panels below the dashed lines the mixing of both memory limiting strategies - F and L - leads to a visible deterioration of the performance. Note, panels (j) and (l) are identical. Default parameters (Table 1) were used
