Fig. 4.
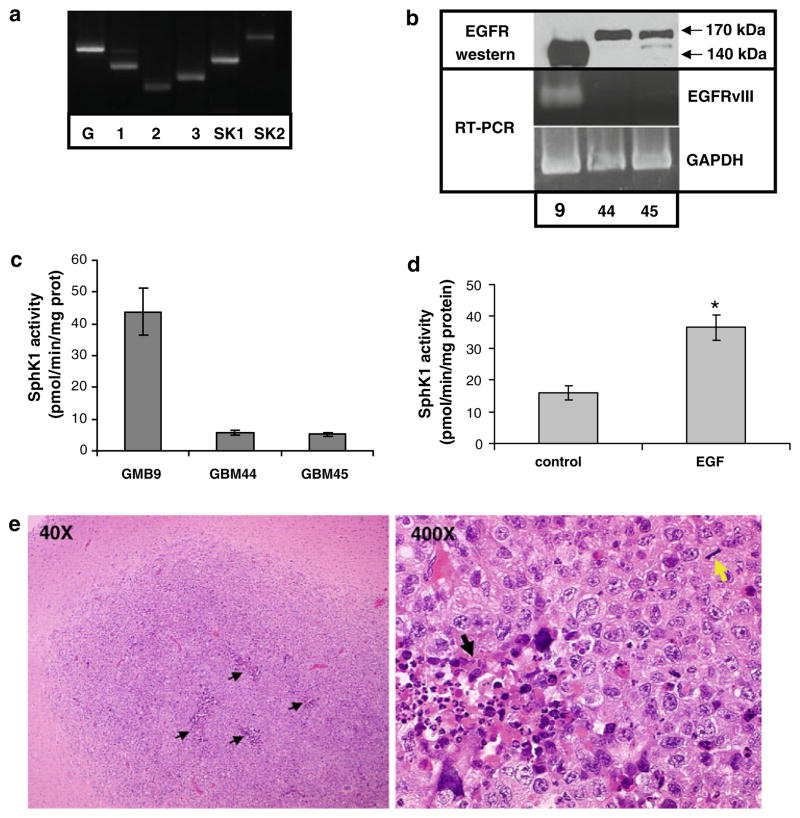
SphK and EGFR in brain tumor stem cells. a RNA was extracted from GBM9 neurosphere cells and RT-PCR analysis was performed to detect expression of SphK isoforms 1 and 2 (SK1 and SK2) and S1P receptors 1, 2, and 3. b Cell lysates from three neurosphere lines were immunoblotted with an antibody that recognizes wt-EGFR and EGFRvIII (top panel). RNA was extracted from the same lines and RT-PCR analysis for expression of the EGFRvIII mutant was performed. c SphK1 activity was measured in lysates from neurosphere lines. d GBM44 cells were treated with or without 20 ng/ml EGF for 8 h and SphK1 activity was measured. Results for panels c and d are means ± s.d. of triplicate samples. Two independent experiments provided similar results. The * indicates statistically significant difference by Student’s T test, p < 0.05. e GBM9 cells were injected into the brains of nude mice and tumors were allowed to develop. Images are micrographs of hematoxylin and eosin stained tissue from a representative mouse brain showing GBM tumors. Black arrows = areas of focal necrosis. Yellow arrow = mitotic figure

