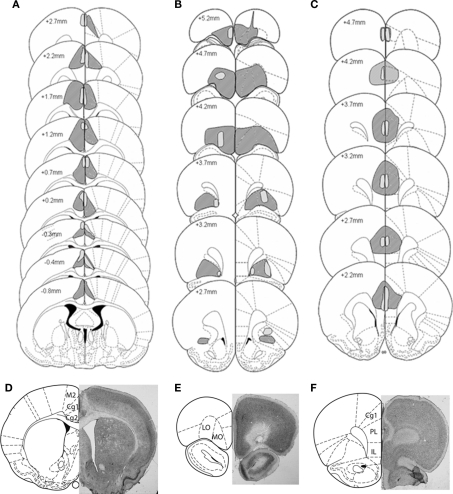
Figure 2.
Representation of the largest (dark shading) and smallest (light shading) lesions at each level of the (A) Anterior Cingulate cortex (B) Orbitofrontal cortex, and (C) Prelimbic cortex lesion groups. Outlines are reproduced from Paxinos and Watson (1997), and represent sections ranging from −0.8 to 5.2 mm anterior to bregma. Microphotographs of representative lesions of the (D) Anterior Cingulate cortex, Orbitofrontal cortex (E), and Prelimbic cortex (F) lesion groups and a schematic representation of coronal sections where photographs were taken, located respectively at 4.7, 3.2, and 0.48 mm anterior to bregma.

