
Figure 2.
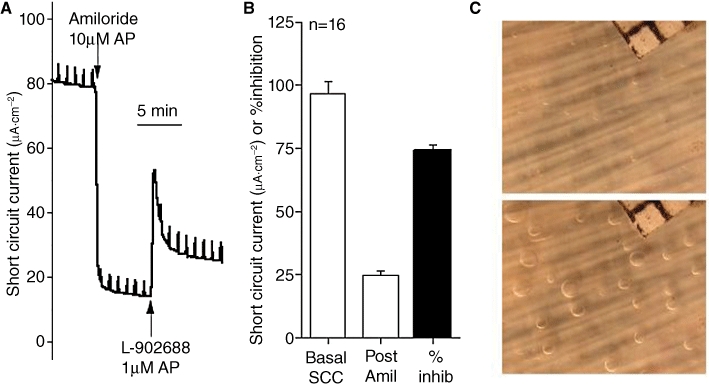
The different components of solute and fluid movement in airway tissue. All the data are derived from experiments on ovine tracheal tissue. (A) shows a recording of short circuit current (SCC), a measure of the total electrogenic transport of cations and anions across the epithelium. As cations are absorbed from the apical surface while anions are secreted in the opposite direction, these two currents will be additive. Sodium absorption can be completely eliminated by adding amiloride (Amil) to the apical surface and shows under the conditions of the experiment that it accounts for ∼75% of the total current. The remaining current, due largely to anion secretion, can be further enhanced, in this instance by the EP4 receptor agonist L-902688. Data in (B) shows that pattern seen in (A) is confirmed. These results suggest that in the basal state the airway surface epithelia are absorptive. However, it is to be remembered that the in vivo condition is very different. First, under SCC conditions, the apical surface is bathed in a solution of infinite volume, compared to the airway surface liquid (ASL), and second, the airway epithelium is removed from the humoral and neural mechanisms present in vivo. However, there is a second source of fluid that contributes to the ASL and derived from the submucosal glands. To measure secretion from individual glands the method first described by Joo et al. 2001 was used. A small area of tracheal mucosa was mounted in a special chamber and bathed on the basolateral side with Krebs solution at 37°C and superfused with 95%O2/5%CO2. The apical surface, after cleaning and drying, was covered with a thin layer of water saturated mineral oil. Secretion from individual glands collected as spherical droplets at the mouth of the glands. A sequence of photographs of the airway surface at timed intervals allowed the secretion rate to be calculated using ImageJ software. (C) shows two views of the epithelial surface (10 mm2, corner of grid with 0.5 mm squares is shown) of an ovine trachea before (upper) and a few minutes after (lower) carbachol had been added to the basolateral fluid. Note the appearance of spherical droplets at the surface opening of each gland.