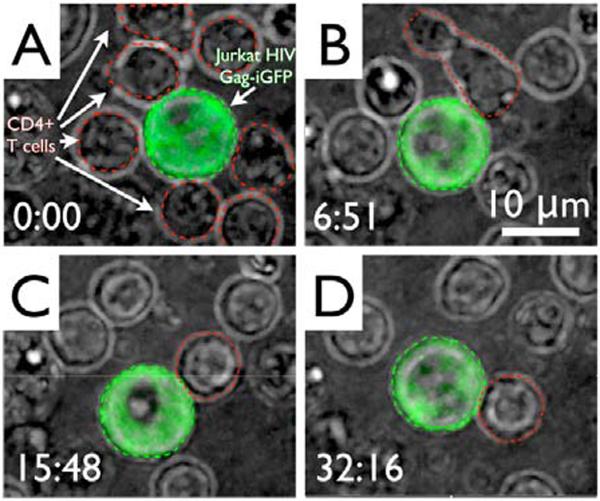
Figure 3.
Formation of an adhesion junction between an HIV Gag-iGFP transfected Jurkat cell (larger, green with green dashed outline) and primary CD4+ T cells (smaller, with red dashed outline) that were loaded around it using optical tweezers. Images are maximum intensity projections of a false color overlay of GFP and red filtered white light image. A) First image after loading. B) Initial contact between the cell pair. C) & D) Stable adhesion between the cell pair over time.

