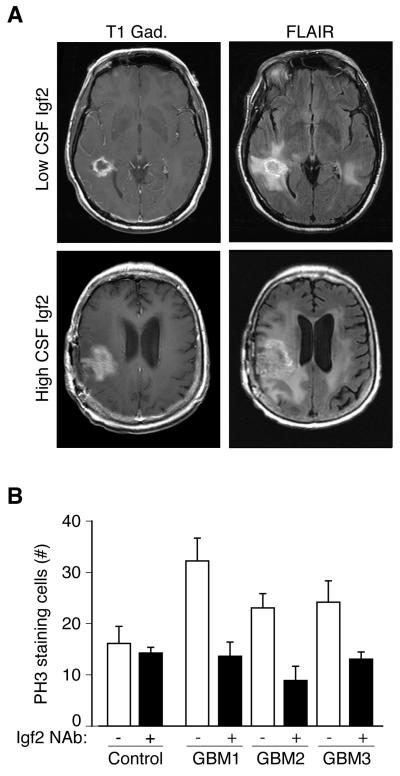
Figure 6. Glioblastoma CSF Igf2 supports progenitor proliferation.
(A) MRI scans from subjects with low and high CSF Igf2 levels. Gadolinium-enhanced T1-weighted (T1-Gad) MRI sequence delineated the contrast-enhanced portion of the tumor where tumor angiogenesis developed. Fluid attenuation inversion recovery (FLAIR) images included area of non-vascularized and invasive tumor (Macdonald et al., 1990). (B) 20% human GBM CSF in NBM stimulated PH3-positive proliferating cells compared to an average of 3 disease-free control CSFs in E16 rat explants (control = 16.0 ± 4.1 (n=3); GBM1 = 32.3 ± 4.3 (n=4); GBM2 = 23.0 ± 2.8 (n=5); GBM3 = 23.4 ± 3.8 (n=4); Mann-Whitney, p<0.05). Igf2(NAb) inhibited GBM CSF-stimulated progenitor proliferation (GBM1 = 13.5 ± 2.9 (n=4); GBM2 = 9.0 ± 2.7 (n=4); GBM3 = 13.0 ± 1.5 (n=3); Mann-Whitney, p<0.05). CSF Igf2 concentration before and after Igf2 NAb absorption: GBM1(PBS) = 605.8ng/ml; GBM1(NAb) = 45.6ng/ml; GBM2(PBS) = 502.8ng/ml; GBM2(NAb) = 218.3ng/ml; GBM3(PBS) = 468.7ng/ml; GBM3(NAb) = 248.8ng/ml).

