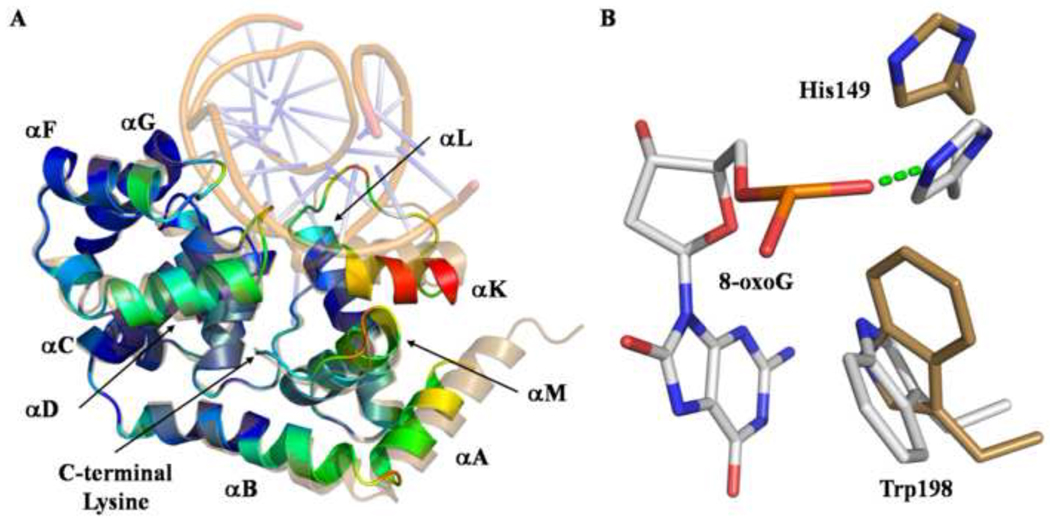
Fig. 5.
A) Superposition of apo-MjaOgg (RCSB PDBid:3FHF 17) and MjaOgg/DNA complex. Apo-MjaOgg is shown in sand color while the MjaOgg/DNA complex is colored according to the RMSD between the two models (blue for low RMSD and red for high RMSD). DNA is shown in transparent mode for clarity. The C-terminal Lys207 superimposes perfectly in both the apo- and liganded forms. B) Close-up view of residues that undergo a large shift upon binding 8-oxoG (apo-MjaOgg amino acids are shown in beige and the MjaOgg/DNA complex residues are depicted in standard CPK colors).

