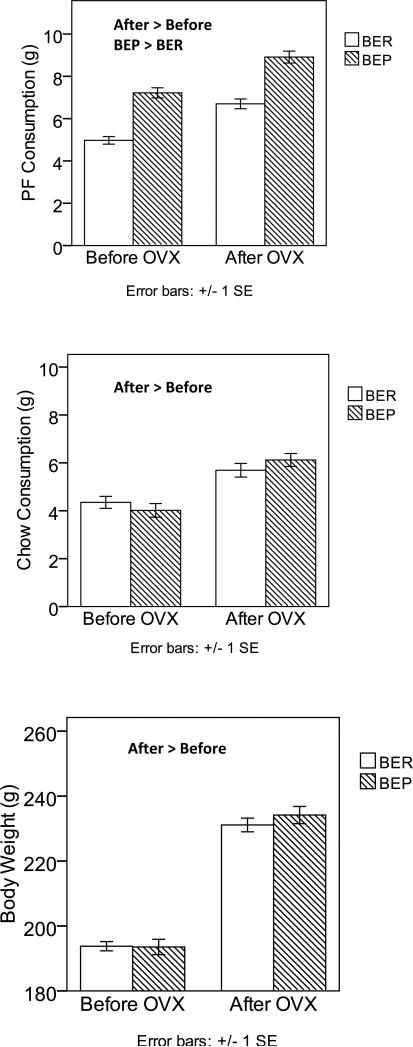
Figure 1. Changes in PF Intake, Chow Intake, and Body Weight after Ovariectomy in BER and BEP Rats from Experiment 1.
Changes in PF consumption are shown in the top panel, changes in chow consumption are shown in the middle panel, and changes in body weight are shown in the bottom panel. Values are means with ± 1 standard errors. PF and chow intake were measured at the 4-hour time point, while body weight was measured at 24 hours. Groups that are significantly different from each other at p < .05 are indicated within the figure.

