
Table 1.
Antiparasitic, antibacterial and cytotoxic activities of semisynthetic erythromycin analogues.
| Cmpd. # | IC50 (μM) T. gondii | MIC (μM) B. subtilis | CC50 (μM) | ||
|---|---|---|---|---|---|
| 1 | Erythromycin | 93 ± 10 | 0.04 | 475 | |
| 2 | Clarithromycin | 31 ± 5 | 0.04 | 260 | |
| 3 | Azithromycin | 20 ± 2 | 0.15 | 174 | |
|
| |||||
|
R1
| |||||
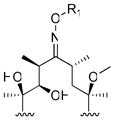
|
4 |
|
14 ± 2 | 0.04 | 22 |
| 5 |
|
1.6 ± 0.2 | 0.04 | 7 | |
| 6 |
|
2.7 ± 1 | 0.04 | 16 | |
| 7 |

|
1.4 ± 0.1 | 0.04 | 3 | |
|
| |||||
|
R2
| |||||
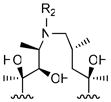
|
8 |
|
65 ± 7 | 1.2 | 386 |
| 9 |
|
16 ± 3 | 0.6 | 139 | |
| 10 |
|
13 ± 2 | 0.3 | 103 | |
| 11 |

|
2 ± 0.2 | 0.3 | 32 | |
| 12 |

|
85 ± 3 | 10 | 480 | |
| 13 |

|
12 ± 0.3 | 1.2 | 222 | |
|
| |||||
|
R3
| |||||
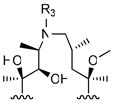
|
14 |
|
106 ± 11 | 2.5 | 460 |
| 15 |
|
89 ± 7 | 5 | 454 | |
| 16 |
|
20 ± 2 | 1.2 | 106 | |
| 17 |
|
13 ± 1 | 0.8 | 84 | |
| 18 |

|
2 ± 0.1 | 0.3 | 13 | |
| 19 |

|
59 ± 4 | 10 | 409 | |
| 20 |
|
16 ± 0.4 | 1.5 | 62 | |
|
| |||||
|
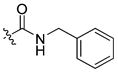
R4
| |||||
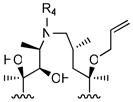
|
21 |
|
40 ± 1 | 2.5 | 74 |
| 22 |
|
25 ± 0.7 | 10 | 96 | |
| 23 |
|
15 ± 0.6 | 10 | 42 | |
| 24 |
|
12 ± 0.4 | 5 | 38 | |
| 25 |

|
5 ± 0.3 | 6 | 14 | |
| 26 |

|
33 ± 2 | 5 | 90 | |
| 27 |
|
6 ± 0.4 | 1.5 | 28 | |
To quantify the antiparasitic activity of each compound, cultures of human foreskin fibroblast (HFF) cells grown in 96-well plates were infected with T. gondii cells 2F-1 YFP2 (T. gondii YFP) 36 expressing the yellow fluorescent protein under control of a constitutive promoter. Each compound was titrated into infected cultures at varying dilutions. Infected cultures were incubated for 4 days (2 infection cycles) in the continuous presence of compounds. Antibacterial activity was measured as the minimum inhibitory concentration (MIC) against the representative Gram-positive bacterium B. subtilis. Two-fold incremental dilutions of each compound were added to freshly inoculated cultures of B. subtilis. The lowest concentration at which no growth was observed was recorded as the MIC value. Cytotoxicity was determined in parallel with antibacterial and antiparasitic activity with MTS (3-(4,5-dimethylthiazol-2-yl)-5-(3-carboxylmethoxylphenyl)-2H-tetrazolium) assay. Low passage HFF cells (2 × 10³ cells/well) were seeded into the 96-well culture plates, and incubated for 24h at 37 °C. Then, the HFF cells were exposed to the various concentrations of macrolides for 2 days. After incubation, the macrolide treated medium was aspirated, and fresh medium and MTS were added in order. The plates were incubated for 4h at 37 °C, and the optimal density was measured at 490nm. CC50 was determined by cytotoxic dose of macrolides reducing cell viability by 50%.