
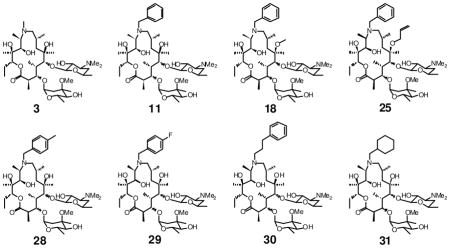
Table 2.
Antiparasitic, antibacterial and cytotoxic activities of selected azalides.
 | ||||||
|---|---|---|---|---|---|---|
| IC50 (μM)
|
MICa (μM) | CC50b (μM) | ||||
|
0h |
6h |
|||||
| 1st cycle | 2nd cycle | 1st cycle | 2nd cycle | |||
| 3 | 29 ± 2 | 0.6 ± 0.07 | 44 ± 5 | 0.6 ± 0.03 | 0.15 | 174 |
|
| ||||||
| 11 | 5 ± 1 | 0.5 ± 0.10 | 9 ± 1 | 0.5 ± 0.05 | 0.3 | 32 |
|
| ||||||
| 18 | 7 ± 0.3 | 5 ± 0.2 | 10 ± 1 | 4 ± 0.5 | 0.3 | 13 |
|
| ||||||
| 25 | 7 ± 1 | 10 ± 1 | > 10 | > 10 | 6.0 | 14 |
|
| ||||||
| 28 | 5 ± 1 | 0.6 ± 0.04 | 9 ± 1 | 0.7 ± 0.05 | 0.3 | 38 |
|
| ||||||
| 29 | 6 ± 1 | 0.5 ± 0.07 | 9 ± 1 | 0.7 ± 0.01 | 0.3 | 31 |
|
| ||||||
| 30 | 4 ± 1 | 0.6 ± 0.06 | 8 ± 1 | 0.6 ± 0.01 | 0.6 | 33 |
|
| ||||||
| 31 | 7 ± 1 | 0.6 ± 0.10 | 12 ± 2 | 0.6 ± 0.07 | 0.3 | 36 |
“0 h” data refers to results from experiments in which macrolide and parasite were simultaneously added to fibroblast cultures, whereas “6 h” data was obtained from experiments in which parasites were first allowed to infect before addition of the macrolide.
a
MIC: minimum inhibitory concentration against B. subtilis.
b
CC50: cytotoxic concentration at which human foreskin fibroblast viability drops by 50%