Figure 1.
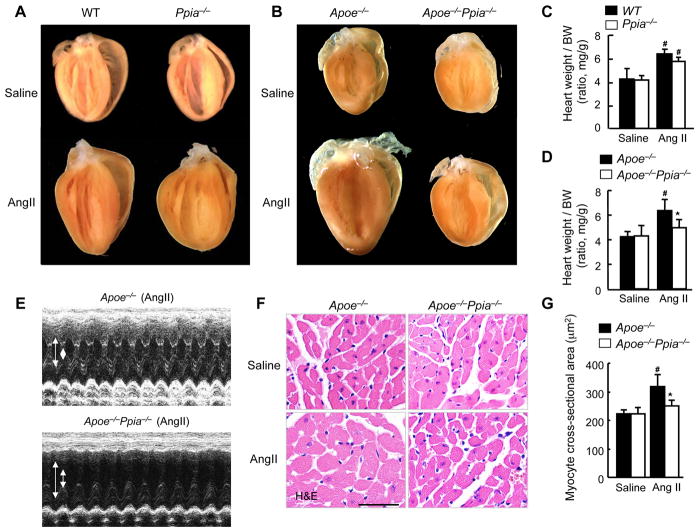
CyPA deficiency prevents AngII-induced cardiac hypertrophy in Apoe−/− mice. (A) Representative photographs showing macroscopic features of cardiac hypertrophy induced by AngII infusion in Ppia−/− mice versus WT mice. AngII-induced cardiac hypertrophy is not prevented in Ppia−/− mice compared with WT mice. (B) Representative photographs of the hearts of Apoe−/− and Apoe−/− Ppia−/− mice infused with AngII or saline for 4 weeks. AngII-induced cardiac hypertrophy is prevented in Apoe−/− Ppia−/− mice compared with Apoe−/− mice. (C) AngII-induced cardiac hypertrophy (heart weight per body weight ratio, HW/BW) was not significantly decreased in Ppia−/− (n = 5) compared with WT (n = 6). # equals P< 0.05 in Saline versus AngII; *equals P< 0.05 in WT versus Ppia−/− mice. (D) AngII-induced cardiac hypertrophy (heart weight per body weight ratio) was significantly reduced in Apoe−/− Ppia−/− mice (n = 11) compared with Apoe−/− mice (n = 15). No significant differences were found in the control groups (saline infusion) of Apoe−/− and Apoe−/− Ppia−/− mice (n=4, respectively). (E) Representative M-mode images of cardiac hypertrophy assessed by echocardiography after 4 weeks of AngII infusion. Arrows show the diastolic left ventricle (LV) cavity and systolic LV cavity. (F) H&E staining of representative cross-sections of cardiac myocytes of Apoe−/− and Apoe−/− Ppia−/− mice 4 weeks after AngII infusion. (G) Myocyte cross-sectional area was significantly reduced in Apoe−/− Ppia−/− mice (n = 7) compared with Apoe−/− mice (n = 9). Results are mean ± SD. # equals P< 0.05 in Saline versus AngII; *equals P< 0.05 in Apoe−/− versus Apoe−/− Ppia−/− mice.

