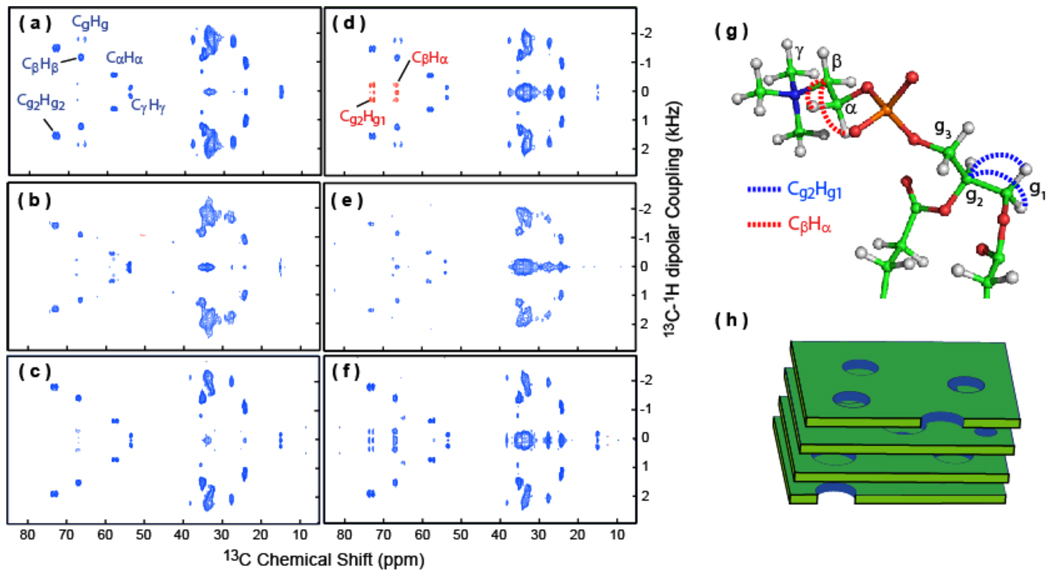
Figure 9. PELF-mix spectra reveal long-range correlations in the head group region of lipids in bicelles.
2D PELF-mix spectra of magnetically-aligned 7:2 DHPC/DMPC bicelles (prepared at a q ratio of 3.5 and 25 weight % lipids) at 35 °C with no mixing time (a) and 1 ms mixing time (d). Note that selected dipolar couplings of the lipid headgroups are labeled and long-range dipolar couplings are shown in red. 2D PELF-mix spectra of magnetically-aligned bicelles containing a 5 mole % MSI-78 with 0 (b) and 1 ms (e) mixing times, and magnetically-aligned bicelles containing a 5 mole % curcumin with 0 (c) and 1 ms (f) mixing times. (g) A ball-and-stick model of the phosphatidylcholine (PC) headgroup of the DMPC. Selected carbon atoms are labeled in green, the hydrogen atoms are shown in grey, nitrogen in blue, oxygen in red, and phosphorus in orange. The long distance 13C-1H dipolar coupling detected in PELF-mix are indicated using dashed lines. (h) A mixture of DHPC and DMPC known as bicelles from a magnetically aligned phase that resembles stacked slices of swiss cheese at q=3.5.

