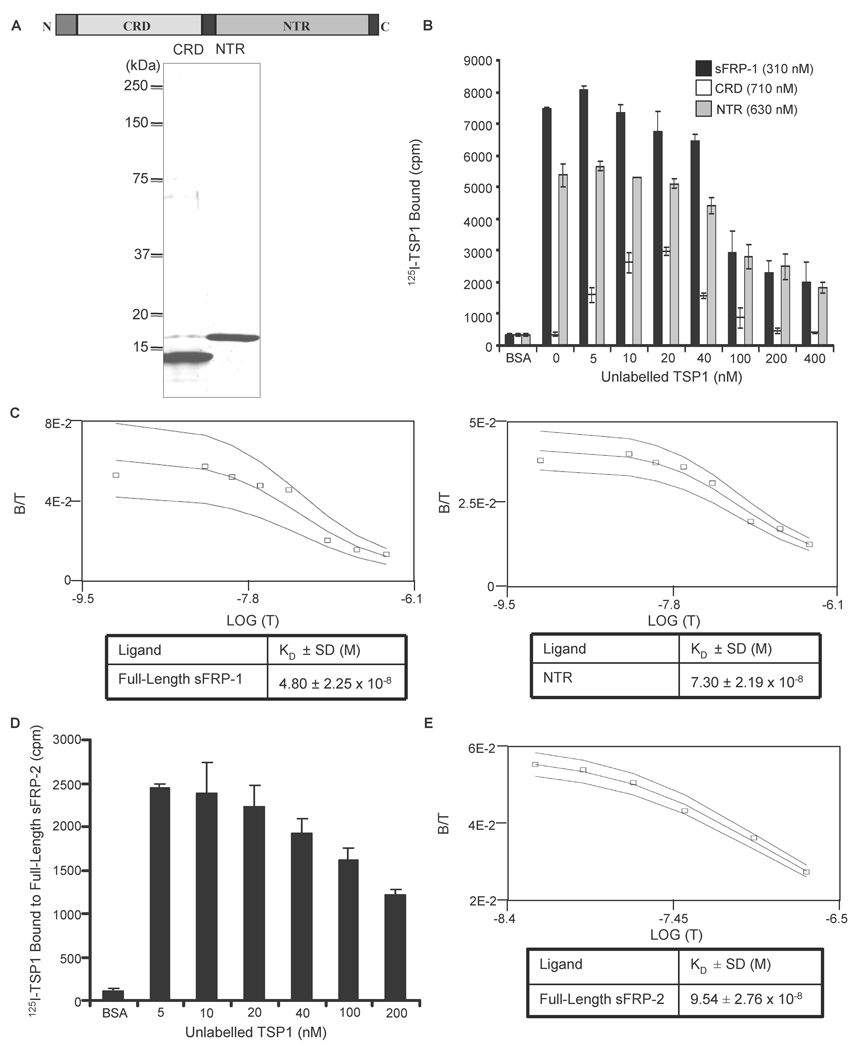
Figure 2. Equilibrium binding of 125I-TSP1 to sFRP-1 and sFRP-2.
Schematic diagram of sFRP-1 modular structure and Coomassie blue-stained SDS-polyacrylamide gel containing purified CRD and NTR domain of sFRP-1 (A). 125I-TSP1 binding to full-length sFRP-1 or the sFRP-1 domains (CRD and NTR domain) was performed in microtiter plate wells coated with 50 µl/well of 10 µg/ml of each protein. Nonspecific binding was blocked with 3% (w/v) BSA in DPBS containing Ca2+ and Mg2+, at room temperature for 1 h. Binding was measured at 37°C in the presence of competing concentrations of unlabelled TSP1 (B). The Ligand program was used for quantitative analysis of the binding data. Results for sFRP-1 and NTR domain (C left and right, respectively) are presented as displacement plots, and are representative of three (sFRP-1) and two (NTR domain) independent experiments performed in triplicate. Microtiter plate wells were coated using 50 µl/well of 5 µg/ml of full-length sFRP-2. Nonspecific binding was blocked with 3% (w/v) BSA in DPBS containing Ca2+ and Mg2+, at room temperature for 1 h. 125I-TSP1 binding was measured at 37°C in the presence of the indicated concentrations of unlabelled TSP1 (D). The Ligand program was used for quantitative analysis of competitive binding. Results are presented as displacement plots (E), and are representative of two independent experiments performed in triplicate.

