
Fig. 7.
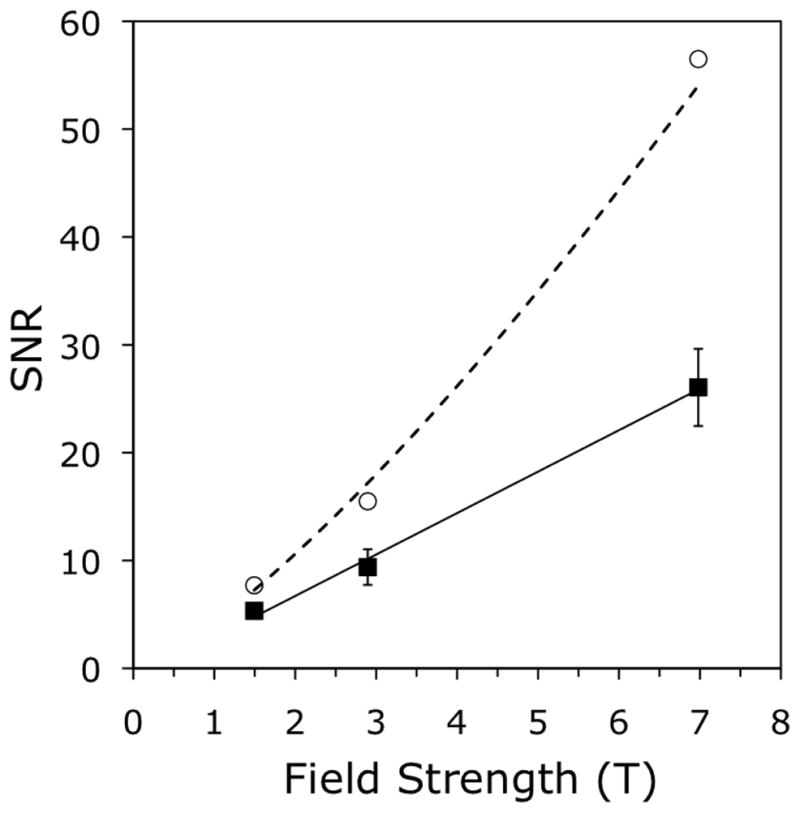
Average SNR in vivo versus field strength, measured at the same location in the distal tibia on registered images acquired at 1.5 T, 3 T, and 7 T, for three subjects. Measured values (black squares) have an approximately linear dependence, confirmed by a linear fit (R2 = 0.996) of SNR ∞ B0 (solid line). Values corrected for differential T1 saturation (white circles) show a super-linear dependence: (dotted line).