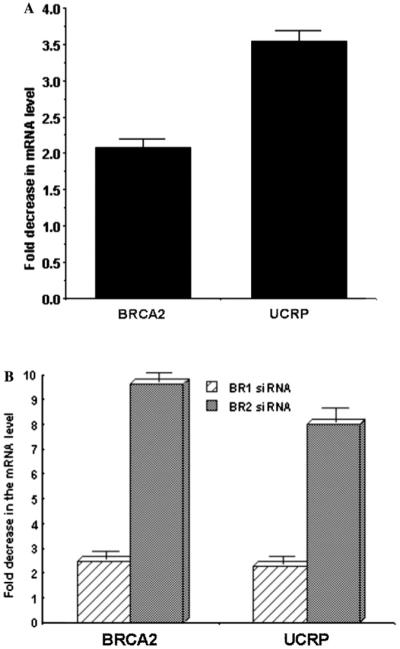
Fig. 2.

Real-time PCR analysis of BRCA2 and UCRP mRNA in (A) anti-BRCA2 phosphorothioate gapmer-treated (48 h) HMEC cells and (B) BR1 and BR2 siRNA-treated (48 h) BT549 cells. 18S rRNA was used as normalizing control. Results are means ± SE (n = 6). Sense control gapmer treated cells were used as control. Fold decrease in the UCRP mRNA level is proportional to the fold decrease in the BRCA2 mRNA level.
