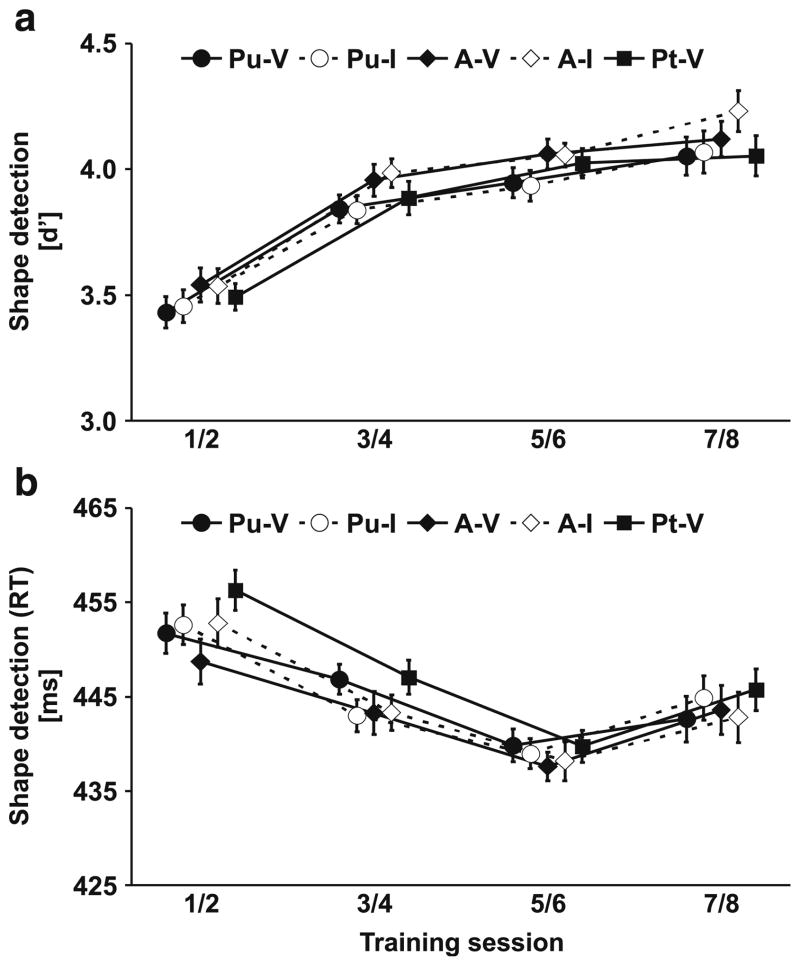
Fig. 4.
Shape detection during training. a) Sensitivity measures (d′). b) Mean response times. Shape detection improved at all visual field locations (Pt, A, Pu) and both when sounds were presented at the same (valid) side (V) or the opposite (invalid) side (I). In addition, a location-specific change of the validity effect was observed on response times (see Fig. 5). Two consecutive training sessions were pooled. Error bars reflect within-subjects s.e.m. (Loftus & Masson, 1994) for the factor Training Session. n = 17

