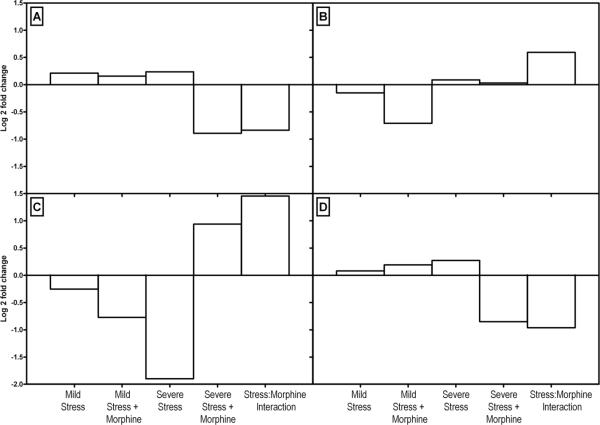
Figure 2. qPCR of selected hippocampal genes by treatment condition.
qPCR results are normalized to GAPDH. The X axis shows the conditions: mild stress, mild stress + morphine, severe stress, severe stress + morphine and interaction effects of stress. The Y axis shows the log 2 fold change in gene expression. Expression of Nav1 (Panel A), Wnt2 (Panel B), Spp1 (Panel C), and Reln (Panel D) differ by treatment group, demonstrating that the effect of morphine is not necessarily predictable.

