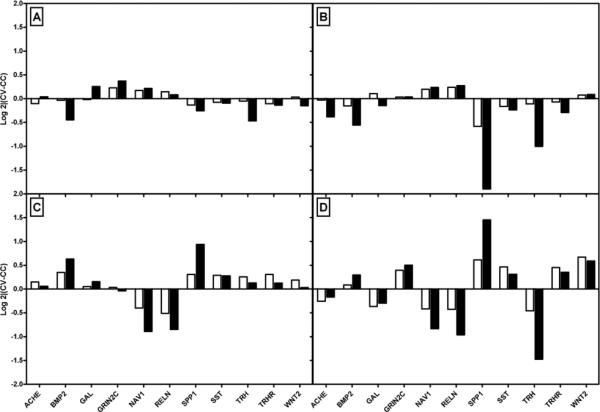
Figure 6. Validation of Microarray Results by qPCR.

Microarray results were validated in 16 genes in all comparison conditions. A subset of 11 genes and conditions are shown in this figure. Panel A shows effects of mild stress; Panel B the effect of severe stress; Panel C shows effects of severe stress combined with morphine, and Panel D shows the stress: morphine interaction effects. Microarray results are shown in clear bars, and qPCR results in black for 11 genes. Gene names are listed on the X-axis. The Y axis shows the log 2 fold change in gene expression.
