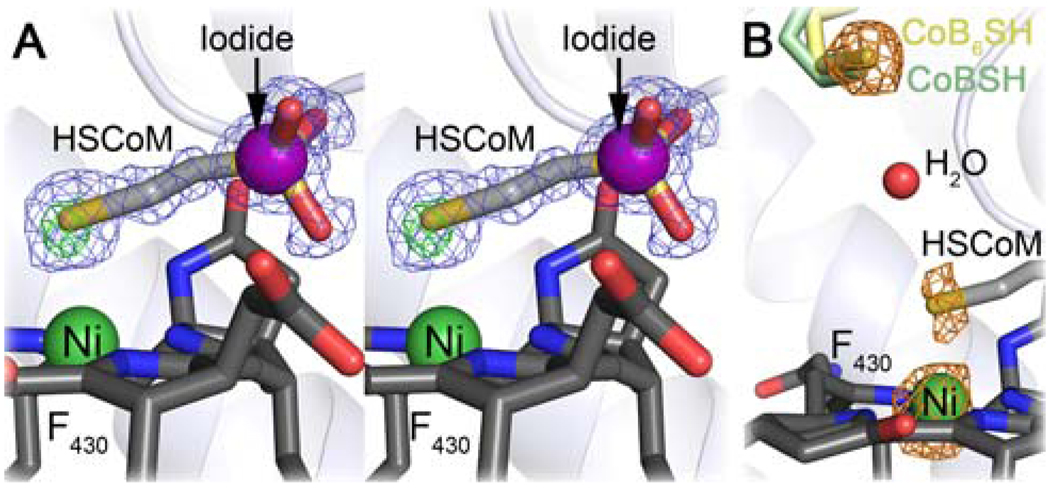
Figure 1.
Ni-methyl MCR electron density. A) Stereo figure showing positive Fo − Fc electron density (green mesh, contoured at 5σ) when methyl is not included in the structural model. 2Fo − Fc electron density (contoured at 1σ) is shown as blue mesh. B) Anomalous electron density map from X-ray diffraction data collected at wavelength 2.29 Å (orange mesh, contoured at 5σ) (f″ (electrons): sulfur 1.14; nickel 1.03). Coenzymes are shown in stick colored by atom (carbon: CoB6SH, pale yellow; CoBSH, pale green; HSCoM, light grey (faded); coenzyme F430, dark grey with the Ni atom shown as green sphere). Iodide as a purple sphere and a water molecule as a red sphere. Protein is shown as cartoon.

