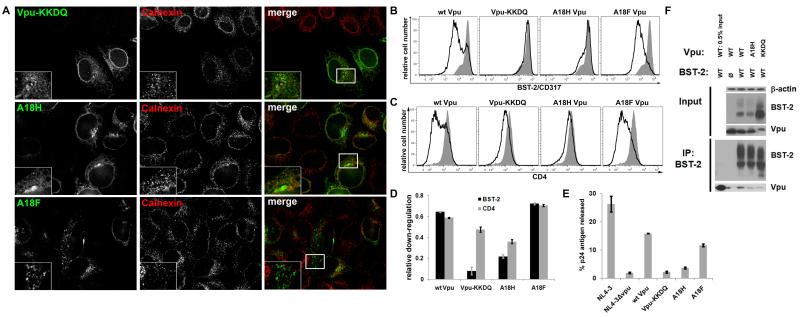
Figure 6. Vpu-KKDQ is impaired as a BST-2 antagonist while Vpu-A18F appears similar to wt Vpu.
(A) Cells (HeLa) were transfected with plasmid expressing the indicated codon-optimized Vpu (160ng). The next day the cells were fixed, permeabilized, and co-stained for Vpu (green) and BST-2 (red). (B) Cells (HeLa) were transfected with either an empty vector plasmid or a plasmid expressing codon-optimized Vpu (160ng), along with a plasmid expressing GFP (80ng) as a transfection marker. The next day, the cells were stained for surface BST-2 and analyzed by two-color flow cytometry. Histograms represent the relative cell number vs. BST-2 fluorescence intensity for the GFP-positive cells. The transfection efficiency, as indicated by the percentage of GFP-positive cells, was approximately 30% for each of the transfections. The black line represents the level of surface BST-2 down-regulation achieved when Vpu is present. The shaded grey peak represents the levels of surface BST-2 present when transfected with empty vector. (C) Cells (HeLa) were transfected as described in 6B. The next day, the cells were stained for surface CD4 and analyzed by two-color flow cytometry. Histograms represent the relative cell number vs. CD4 fluorescence intensity for the GFP-positive cells. The black line represents the level of surface CD4 down-regulation achieved when Vpu is present. The shaded grey peak represents the levels of surface CD4 present when transfected with empty vector. (D) The bar graph indicates the fractional BST-2 and CD4 down-regulation achieved by each Vpu tested. The values were determined as 1-[(Vpu-MFI - isotype MFI) / (empty vector-MFI – isotype-MFI)]; value of 1.0 indicates complete down-regulation of surface BST-2 or CD4, whereas a value of 0 indicates no down-regulation. (E) Cells (HeLa) were transfected with either a proviral plasmid expressing wild type HIV-1NL4-3 or a vpu-negative proviral plasmid vpuDEL-1 (ΔVpu) (1.6μg). Each of the Vpu mutant-proteins was expressed in trans (160ng) with ΔVpu to assess their activity in virion release. The next day, the fraction of the total p24 capsid antigen produced by the cells that was secreted into the media was measured by ELISA. The average values from two independent experiments are graphed; the error bars indicate the actual values obtained from each experiment. (F) Cells (HEK293T) were transfected as in Figure 3C. The immunoprecipitated proteins were analyzed via immunoblot. The upper panel shows β-actin as the loading control and input (expression) controls for BST-2 and Vpu. The lower panel shows the immunoprecipitation of BST-2 and the co-immunoprecipitation of each Vpu mutant.

