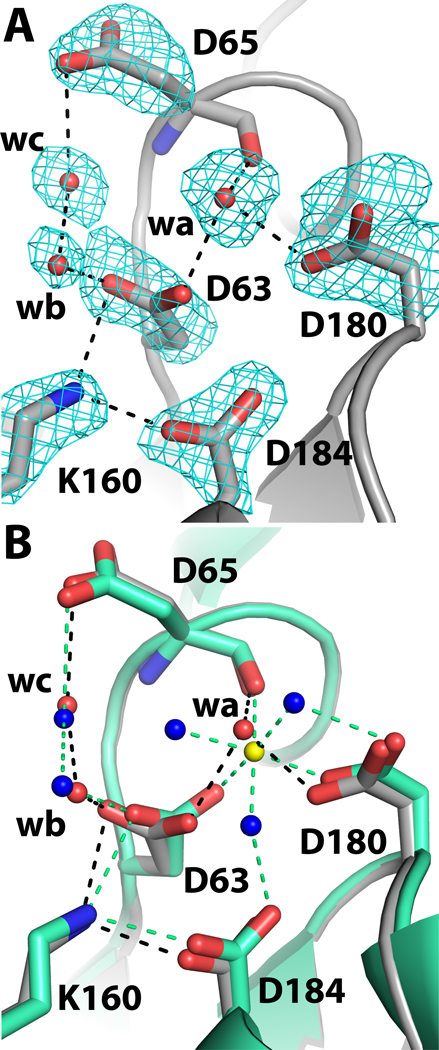
Fig. 2.
Close-up views of the phosphoryl binding site of rPmCCAP. (A) Electron density near the phosphoryl binding site. The cage represents a simulated annealing σA-weighted Fo - Fc omit map contoured at 3.0 σ. Prior to map calculation, the side chains and water molecules shown were removed, and simulated annealing refinement was performed using PHENIX. The water molecule denoted wa occupies the expected Mg2+ site. (B) Comparison of rPmCCAP (silver) and rP4 (green, PDB code 3ET4). Water molecules of rPmCCAP are colored red, while those of rP4 are colored blue. The Mg2+ ion of rP4 is shown in yellow. Black and green dashed lines denote electrostatic interactions in rPmCCAP and rP4, respectively.

