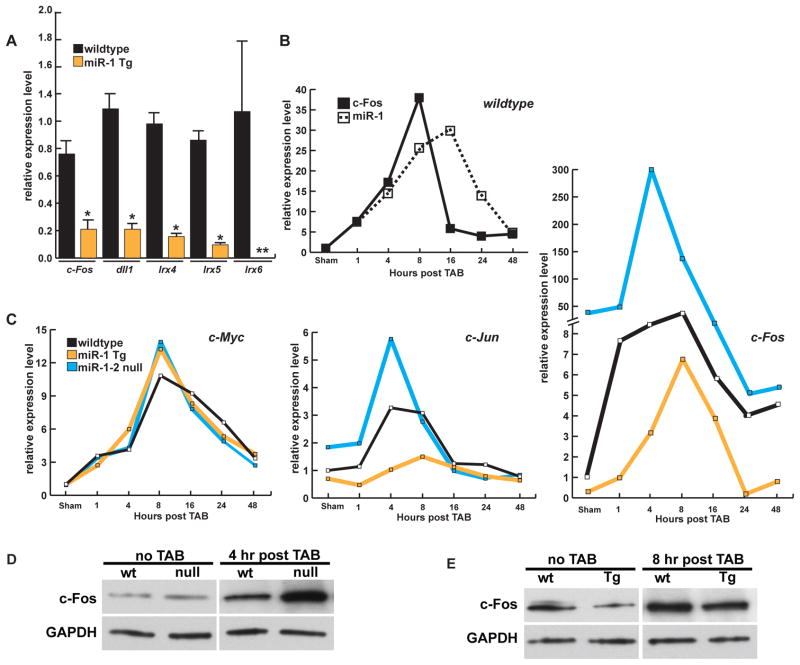
Figure 6. miR-1-2 limits stress-induced activation of the kay orthologue, c-Fos, in mouse hearts.
(A) Quantification of mRNA levels for mouse homologues of genes found to have a genetic interaction with dmiR-1 in wildtype (black) or α-MHC-miR-1 transgenic (Tg) mice (yellow). *p=<0.05. dll1:delta-like-1, Irx4,5,6: Iroquois family 4,5,6. All values normalized to GAPDH levels. ** not detectable. n=4 animals for each time point. Error bars are represented as standard error of the mean.
(B) Time course of c-Fos or miR-1 expression after thoracic aortic banding (TAB) by qPCR in wildtype mice.
(C) Time course of c-myc (left), c-Jun (middle) and c-Fos (right) expression as determined by qPCR analysis after TAB. Wildtype animals (black), α-MHC-miR-1 transgenic mice (yellow) and miR-1-2 null (blue) mice are indicated.
(D–E) Western blots of mouse hearts at time points of maximal c-Fos induction in miR-1-2 null (ko) (D) or α-MHC-miR-1 transgenic (Tg) animals (E) after TAB.

