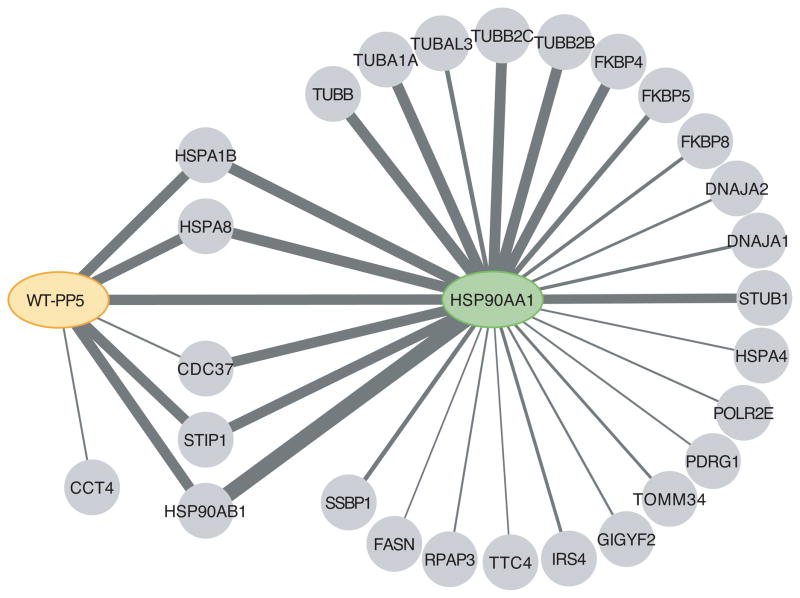
Figure 2. Cytoscape representation of the wt-PP5 and Hsp90 interaction partners.
AP-MS data is from Table I; all interaction partners have an AvgP≥0.5. The thickness of the lines is proportional to the total spectral counts for the hits in the four biological replicates purifications of the bait.

