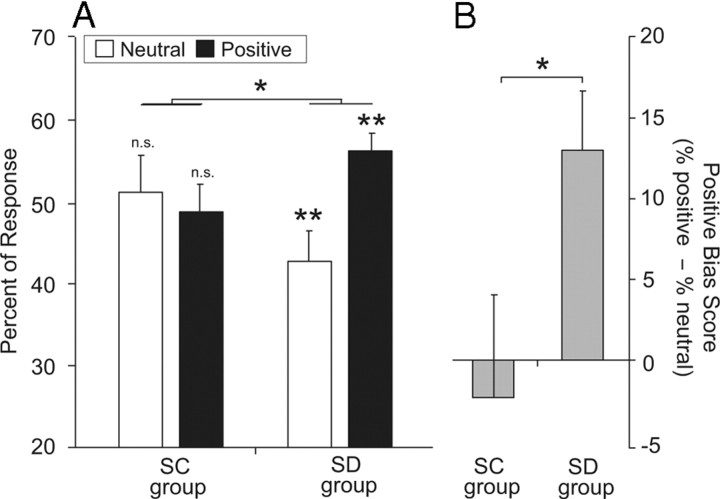
Figure 1.
Stimulus ratings. A, The proportion of stimuli categorized as either positive (pleasant) or neutral in the sleep-control (SC) and sleep-deprivation (SD) groups. A mixed-design ANOVA [between-subject factor of group (sleep control, sleep deprivation) and within-subjects factor of emotional response (pleasant, neutral)] demonstrated no significant main effect of group (F(1,25) = 0.19, p = 0.67) and no significant main effect of emotional response (F(1,25) = 2.02, p = 0.16), but a significant group × emotional response interaction (F(1,25) = 4.09, p = 0.04; across group and condition comparison). Post hoc tests within each group (symbol above bar) represent comparisons of each category to the null hypothesis of equal categorical assignment (50%), with significance values provided in the main text. B, The corresponding change in response tendency, characterized as positive bias score, represented as the subtracted difference in the proportion of positive items relative to the proportion of neutral items in the sleep-control and sleep-deprivation group. A zero value represents equal numbers of stimuli assigned to neutral and pleasant categories, while a positive score represents a greater proportion of stimuli rated as pleasant relative to neutral (and vice versa). Comparison reflects significance at p < 0.05 (*) and p < 0.01 (**). n.s., Nonsignificant. Error bars represent s.e.m. Corresponding response times and analyses are provided in supplemental Table 1 (available at www.jneurosci.org as supplemental material).

