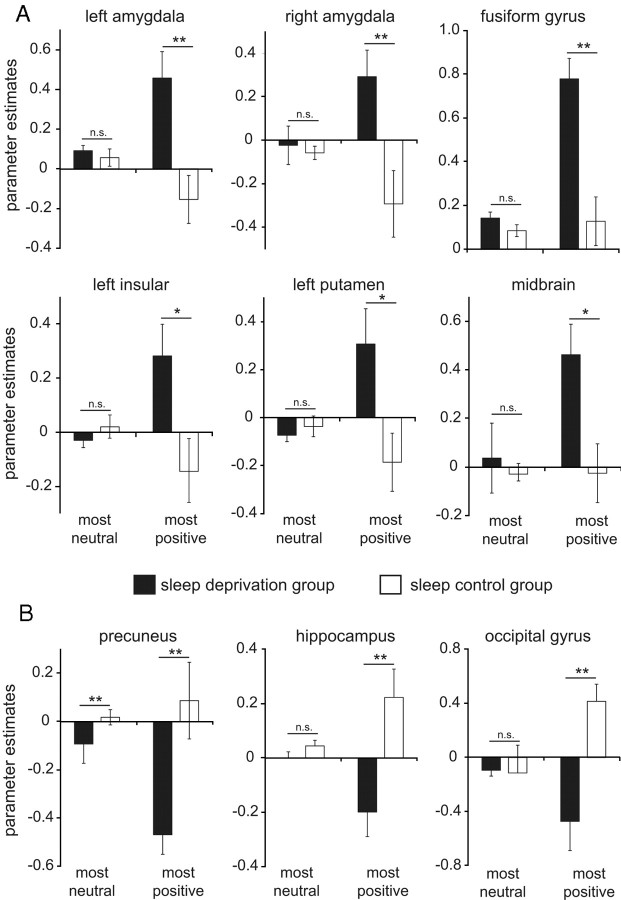
Figure 3.
Histograms of parameter estimates (effect size) for nonparametrically modulated activity in regions of group-level difference, displayed in Figure 2, but for a subset analysis of the 25 most neutral and 25 most positive images. To determine whether increases in activation observed in the sleep-deprivation group were due to a generalized (nonspecific) amplified reactivity to all stimulus kinds, independent of emotion strength, a further subset analysis of the upper quartile stimulus set (most positive) and lower quartile stimulus set (most neutral) was performed for regions identified as different between the two groups. A, For all regions described as more reactive in the deprivation group (Fig. 2A), the subset analyses revealed similar activation levels between the two groups in response to the most neutral pictures, yet highly significant differences between groups for the most positive pictures. Between-group statistical t test comparisons are provided within the figure. All within-group comparisons between the most neutral and most positive stimuli were significant in the deprivation group (all p < 0.04), yet nonsignificant in the control group (all p > 0.12), with the exception of activity in the right amygdala, which showed a trend toward significance (p = 0.07). Therefore, across all regions showing greater reactivity in the deprivation group across the entire stimulus set, a condition-specific relationship was observed, expressly in response to positive stimuli, while reactivity to more neutral images was similar in the two groups. B, This was also true for the reduction in activity identified in the hippocampus and left occipital gyrus in the deprivation group. However, it was not the case for the remaining region showing decreased reactivity at the overall group level in the sleep-deprived participants—the precuneus—which demonstrated nonspecific reductions in reactivity for both neutral and negative stimulus subsets, relative to the control group. Between-group statistical t test comparisons are provided within figure. All within-group comparisons between the most neutral and most positive stimuli were significant in the control group and deprivation group (all p < 0.03), with the exception of activity in the precuneus in the control group (p = 0.56). All between group comparisons reflect significance at p < 0.05 (*) and p < 0.005 (**). Error bars represent s.e.

