
Figure 4.
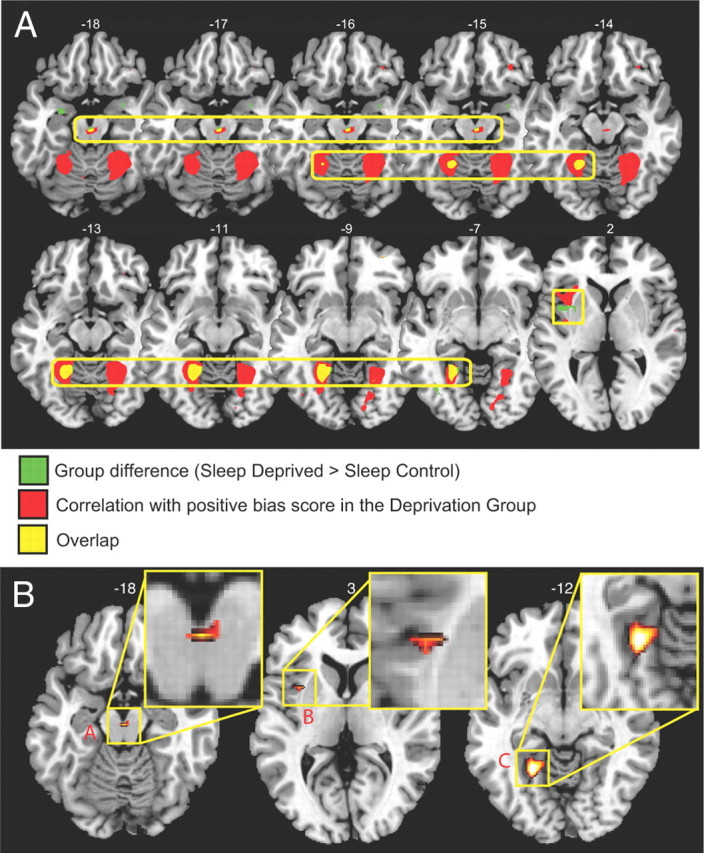
fMRI correlation and conjunction analyses. A, Regions of task-related activation that were significantly more active in the sleep-deprivation group than in the sleep-control group at the overall group level (green; as described in Fig. 2A), together with regions showing a correlation with the positive bias score within the sleep-deprivation group (red, as above), and the overlap homology between the two (yellow with yellow box surround), identifying the insular, VTA, and fusiform gyrus. Coordinates are provided in supplemental Table 2 (available at www.jneurosci.org as supplemental material). B, Results of the conjunction test confirming the overlap homology shown in Figure 3B (yellow with yellow box surround) in a priori regions of the insular [A; peak MNI space coordinates (x, y, z): −37, 7, 2], the VTA (B; peak: 1, −21, −18), (C; peak: −24, −53, −12). Images are displayed in neurological convention on T1 anatomical axial slices (MNI slice number above), with left side corresponding to left hemisphere.